
Introduction
At the moment, data scientists are getting a lot of attention, and as a result, books about data science are proliferating. While searching for good books about the space, it seems to me that the majority of them focus more on the tools and techniques rather than the nuanced problem-solving nature of the data science process. That is until I encountered Brian Godsey’s “Think Like a Data Scientist” — which attempts to lead aspiring data scientists through the process as a path with many forks and potentially unknown destinations. It discusses what tools might be the most useful, and why, but the main objective is to navigate the path — the data science process — intelligently, efficiently, and successfully, to arrive at practical solutions to real-life data-centric problems.
Lifecycle of a data science project
In the book, Brian proposes that a data science project consists of 3 phases:

- The 1st phase is preparation — time and effort spent gathering information at the beginning of a project can spare big headaches later.
- The 2nd phase is building the product, from planning through execution, using what you learned during the preparation phase and all the tools that statistics and software can provide.
- The 3rd and final phase is finishing — delivering the product, getting feedback, making revisions, supporting the product, and wrapping up the project.
As you can see from the image, these 3 phases encompass 12 different tasks. I’d like to use this post to summarize these 12 steps as I believe any aspiring data scientists can benefit from being familiar with them.
Phase I — Preparing
The process of data science begins with preparation. You need to establish what you know, what you have, what you can get, where you are, and where you would like to be. This last one is of utmost importance; a project in data science needs to have a purpose and corresponding goals. Only when you have well-defined goals can you begin to survey the available resources and all the possibilities for moving toward those goals.
1 — Setting Goals

In a data science project, as in many other fields, the main goals should be set at the beginning of the project. All the work you do after setting goals is making use of data, statistics, and programming to move toward and achieve those goals.
First off, every project in data science has a customer. Sometimes the customer is someone who pays you or your business to do the project — for example, a client or contracting agency. In academia, the customer might be a laboratory scientist who has asked you to analyze their data. Sometimes the customer is you, your boss, or another colleague. No matter who the customer might be, they have some expectations about what they might receive from you, the data scientist who has been given the project.
In order to understand such expectations, you need to ask good questionsabout their data. Asking questions that lead to informative answers and subsequently improved results is an important and nuanced challenge that deserves much more discussion than it typically receives. Good questions are concrete in their assumptions, and good answers are measurable success without too much cost. Getting an answer from a project in data science usually looks something like the formula, or recipe, below.

Although sometimes one of the ingredients — good question, relevant data, or insightful analysis — is simpler to obtain than the others, all three are crucial to getting a useful answer. The product of any old question, data, and analysis isn’t always an answer, much less a useful one. It’s worth repeating that you always need to be deliberate and thoughtful in every step of a project, and the elements of this formula are not exceptions. For example, if you have a good question but irrelevant data, an answer will be difficult to find.
Now is a good time to evaluate the project’s goals in the context of the questions, data, and answers that you expect to be working with. Typically, initial goals are set with some business purpose in mind. If you’re not in business — you’re in research, for example — then the purpose is usually some external use of the results, such as furthering scientific knowledge in a particular field or providing an analytic tool for someone else to use.
Though goals originate outside the context of the project itself, each goal should be put through a pragmatic filter based on data science. This filter includes asking these questions: (1) What is possible? (2) What is valuable? (3) What is efficient? Applying this filter to all putative goals within the context of the good questions, possible answers, available data, and foreseen obstacles can help you arrive at a solid set of project goals that are, well, possible, valuable, and efficient to achieve.
2 — Exploring Data

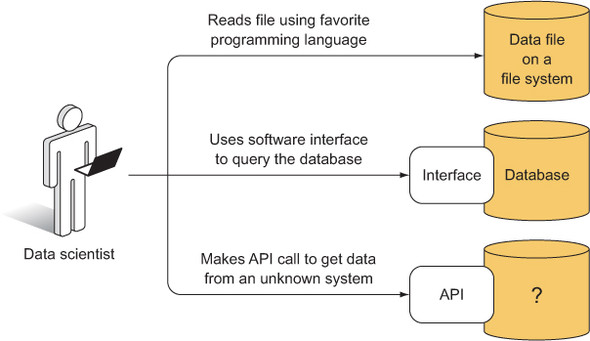
The 2nd step of the preparation phase of the data science process is exploring available data. The figure below shows 3 basic ways a data scientist might access data. It could be a file on a file system, and the data scientist could read the file into their favorite analysis tool. Or the data could be in a database, which is also on a file system, but in order to access the data, the data scientist has to use the database’s interface, which is a software layer that helps store and extract data. Finally, the data could be behind an application programming interface (API), which is a software layer between the data scientist and some system that might be completely unknown or foreign.
It’s best to become familiar with some of the forms that data might take, as well as how to view and manipulate these forms. Here are some of them: Flat Files (csv, tsv), HTML, XML, JSON, Relational Databases, Non-Relational Databases, APIs. Sometimes you don’t have a choice to decide which format to choose. The data comes in a certain format, and you have to deal with it. But if you find that format inefficient, unwieldy, or unpopular, you’re usually free to set up a secondary data store that might make things easier, but at the additional cost of the time and effort it takes you to set up the secondary data store. For applications where access efficiency is critical, the cost can be worth it. For smaller projects, maybe not. You’ll have to cross that bridge when you get there.
Now that you have some exposure to common forms of data, you need to scout for them. Here are the approaches you should consider: Google search, combine different data sources, scrape the web, or measure/collect them yourself. Personally, I’m a big fan of web scraping. Two important things that a web scraper must do well are to visit lots of URLs programmatically and to capture the right information from the pages. If you wanted to know about your friend network on Facebook, you could theoretically write a script that visits the Facebook profiles of all of your friends, saves the profile pages, and then parses the pages to get lists of their friends, visits their friends’ profiles, and so on. This works only for people who have allowed you to view their profiles and friend lists, and would not work for private profiles.
3 — Wrangling Data

Data wrangling, the 3rd step, is the process of taking data and information in difficult, unstructured, or otherwise arbitrary formats and converting it into something that conventional software can use. Like many aspects of data science, it’s not so much a process as it is a collection of strategies and techniques that can be applied within the context of an overall project strategy. Wrangling isn’t a task with steps that can be prescribed exactly beforehand. Every case is different and takes some problem solving to get good results.
Good wrangling comes down to solid planning before wrangling and then some guessing and checking to see what works. Spending a little extra time on data wrangling can save you a lot of pain later. In general, the choice of data wrangling plan should depend heavily on all of the information you discover while first investigating the data. If you can imagine parsing the data or accessing it in some hypothetical way — I try to play the role of a wrangling script — then you can write a script that does the same thing. Pretend you’re a wrangling script, imagine what might happen with your data, and then write the script later. Data wrangling is such an uncertain process that it’s always best to explore a bit and to make a wrangling plan based on what you’ve seen.
There’s no one way or one tool to accomplish the goal of making messy data clean. If someone tells you they have a tool that can wrangle any data, then either that tool is a programming language or they’re lying. Many tools are good for doing many things, but no one tool can wrangle arbitrary data. Data exists in so many forms and for so many purposes that it’s likely that no one application can ever exist that’s able to read arbitrary data with an arbitrary purpose. Simply put, data wrangling is an uncertain thing that requires specific tools in specific circumstances to get the job done. You can try using file format converters or proprietary data wranglers and writing a script to wrangle data.
4 — Assessing Data

It can be tempting to start developing a data-centric product or sophisticated statistical methods as soon as possible, but the benefits of getting to know your data are well worth the sacrifice of a little time and effort. If you know more about your data — and if you maintain awareness about it and how you might analyze it — you’ll make more informed decisions at every step throughout your data science project and will reap the benefits later. Without a preliminary assessment (the 4th step), you may run into problems with outliers, biases, precision, specificity, or any number of other inherent aspects of the data. In order to uncover these and get to know the data better, the first step of post-wrangling data analysis is to calculate some descriptive statistics.
Descriptive statistics is the discipline of quantitatively describing the main features of a collection of information, or the quantitative description itself. Think description, max, min, average values, summaries of the dataset. It’s often hard to discuss descriptive statistics without mentioning inferential statistics. Inferential statistics is the practice of using the data you have to deduce — or infer — knowledge or quantities of which you don’t have direct measurements or data. With respect to a data set, you can say the following:
- Descriptive statistics asks, “What do I have?”
- Inferential statistics asks, “What can I conclude?”
Most statisticians and businesspeople alike would agree that it takes inferential statistics to draw most of the cool conclusions: when the world’s population will peak and then start to decline, how fast a viral epidemic will spread, when the stock market will go up, whether people on Twitter have generally positive or negative sentiment about a topic, and so on. But descriptive statistics plays an incredibly important role in making these conclusions possible. It pays to know the data you have and what it can do for you.
With descriptive stats, you can find entities within your dataset that match a certain conceptual description. If you’re working in online retailing, you might consider customers as your main entities, and you might want to identify those who are likely to purchase a new video game system or a new book by a particular author. If you’re working in advertising, you might be looking for people who are most likely to respond to a particular advertisement. If you’re working in finance, you might be looking for equities on the stock market that are about to increase in price. If it were possible to perform a simple search for these characterizations, the job would be easy and you wouldn’t need data science or statistics. But although these characterizations aren’t inherent in the data (can you imagine a stock that tells you when it’s about to go up?), you often can recognize them when you see them, at least in retrospect. The main challenge in such data science projects is to create a method of finding these interesting entities in a timely manner.
Phase II — Building
After asking some questions and setting some goals, you surveyed the world of data, wrangled some specific data, and got to know that data. In each step, you learned something, and now you may already be able to answer some of the questions that you posed at the beginning of the project. Let’s now move to the building phase.
5 — Developing Plan

The 5th step is to create a plan. As in the earlier planning phase, uncertainties and flexible paths should be in the forefront of your mind. You know more about your project now, so some of the uncertainties that were present before are no longer there, but certain new ones have popped up. Think of your plan as a tentative route through a city with streets that are constantly under construction. You know where you’d like to go and a few ways to get there, but at every intersection there might be a road closed, bad traffic, or pavement that’s pocked and crumbling. You’ll have to make decisions as you arrive at these obstacles, but for now it’s enough to have a backup plan or two.
Plans and goals can change at any moment, given new information or new constraints or for any other reason. You must communicate significant changes to everyone involved with the project, including the customer. The project’s customer obviously has a vested interest in what the final product of the project should be — otherwise the project wouldn’t exist — so the customer should be made aware of any changes to the goals. Because most customers like to be kept informed, it’s often advisable to inform them of your plans, new or old, for how you will achieve those goals. A customer might also be interested in a progress report including what preliminary results you have so far and how you got them, but these are of the lowest priority.
Focus on what the customer cares about: progress has been made, and the current expected, achievable goals are X, Y, and Z. They may have questions, which is great, and they may be interested in hearing about all aspects of your project, but in my experience, most are not. Your one and only must-have conclusion for a meeting with the customer at this stage is that you communicate clearly what the new goals are and that they approve them. Everything else is optional.
You may also consider communicating your basic plan to the customer, particularly if you’re using any of their resources to complete the project. They may have suggestions, advice, or other domain knowledge that you haven’t experienced yet. If their resources are involved, such as databases, computers, other employees, then they will certainly be interested in hearing how and how much you’ll be making use of them.
6 — Analyzing Data
The 6th step of our data science process is statistical analysis of data. Statistical methods are often considered as nearly one half, or at least one third, of the skills and knowledge needed for doing good data science. The other large piece is software development and/or application, and the remaining, smaller piece is the subject matter or domain expertise.
On the one side of statistics is mathematics, and on the other side is data. Mathematics — particularly, applied mathematics — provides statistics with a set of tools that enables the analysis and interpretation. In any case, mathematics generally doesn’t touch the real world. Based wholly on logic and always — always — starting with a set of assumptions, mathematics must first assume a world it can describe before it begins to describe it. Every mathematical statement can be formulated to start with an if (if the assumptions are true), and this if lifts the statement and its conclusion into abstractness. That is not to say that mathematics isn’t useful in the real world; quite the contrary. Mathematics, rather than being a science, is more of a vocabulary with which we can describe things. Some of these things might be in the real world. As with vocabularies and the words they contain, rarely is a description perfectly correct. The goal is to get as close to correct as possible.
Mathematics does, however, provide much of the heavy machinery that statistics uses. Statistical distributions are often described by complex equations with roots that are meaningful in a practical, scientific sense. Fitting statistical models often makes use of mathematical optimization techniques. Even the space in which a project’s data is assumed to lie must be described mathematically, even if the description is mere “N-dimensional Euclidean space.
In addition to mathematics, statistics possesses its own set of techniques that are primarily data-centric.
- Descriptive statistics is a generally intuitive or simple kind of statistics that can provide a good overview of the data without being overly complex or difficult to understand. Descriptive statistics usually stays close to the data, in a sense.
- Inferential statistics is inherently one or more steps removed from the data. Inference is the process of estimating unknown quantities based on measurable, related quantities. Typically, inferential statistics involves a statistical model that defines quantities, measurable and unmeasurable and their relationships to each other. Methods from inferential statistics can range from quite simple to wildly complex, varying also in their precision, abstractness, and interpretability.

Statistical modeling is the general practice of describing a system using statistical constructs and then using that model to aid in the analysis and interpretation of data related to the system. Both descriptive and inferential statistics rely on statistical models, but in some cases, an explicit construction and interpretation of the model itself play a secondary role.
With statistical modeling, the primary focus is on understanding the model and the underlying system that it describes. Mathematical modeling is a related concept that places more emphasis on model construction and interpretation than on its relationship to data. Statistical modeling focuses on the model’s relationship to data. Here are some important concepts in statistical modeling that you should be aware of:
- Linear, exponential, polynomial, spline, differential, non-linear equations.
- Latent variables.
- Quantifying uncertainty: randomness, variance and error terms.
- Fitting a model: maximum likelihood estimation, maximum a posteriori estimation, expected maximization, variational Bayes, Markov Chain Monte Carlo, over-fitting.
- Bayesian vs frequentist statistics.
- Hypothesis testing.
- Clustering
- Component analysis.
Farthest from the raw data is a set of statistical techniques that are often called, for better or worse, black box methods. The term black box refers to the idea that some statistical methods have so many moving pieces with complex relationships to each other that it would be nearly impossible to dissect the method itself because it was applied to specific data within a specific context. Many methods from machine learning and artificial intelligence fit this description. If you attempt to classify individuals appearing in a data set into one of several categories, and you apply a machine learning technique such as a random forest or neural network, it will often be difficult to say, after the fact, why a certain individual was classified in a certain way. Data goes into the black box, a classification comes out, and you’re not usually certain what exactly happened in between. Here are a few of the most popular machine learning algorithms that you would apply to the feature values you extracted from your data points:
- Random forest
- Support vector machine
- Boosting
- Neural network
- Deep learning
7 — Engineering Product

Our next step is to build statistical software. If statistics is the framework for analyzing and drawing conclusions from the data, then software is the tool that puts this framework in action. Beyond going without, a data scientist must make many software choices for any project. If you have a favorite program, that’s often a good choice, if for no other reason than your familiarity with it. But there can be good reasons to pick something else. Or if you’re new to data science or statistical software, it can be hard to find a place to start.
To anyone who has spent significant time using Microsoft Excel or another spreadsheet application, spreadsheets and GUI-based applications are often the first choice for performing any sort of data analysis. Particularly if the data is in a tabular form, such as CSV, and there’s not too much of it, getting started with analysis in a spreadsheet can be easy. Furthermore, if the calculations you need to do aren’t complex, a spreadsheet might even be able to cover all the software needs for the project. Common software tools here are Excel, SPSS, Stata, SAS, and Minitab. Learning the programming language of one of these mid-level tools can be a good step toward learning a real programming language, if that’s a goal of yours. These languages can be quite useful on their own. SAS, in particular, has a wide following in statistical industries, and learning its language is a reasonable goal unto itself.
Programming languages are far more versatile than mid-level statistical applications. Code in any popular language has the potential to do most anything. These languages can execute any number of instructions on any machine, can interact with other software services via APIs, and can be included in scripts and other pieces of software. A language that’s tied to its parent application is severely limited in these capacities.
MATLAB is a proprietary software environment and programming language that’s good at working with matrices. MATLAB costs quite a bit but there are significant discounts for students and other university-affiliated people. Some folks decided to replicate it in an open-source project called Octave. As Octave has matured, it has become closer and closer to MATLAB in available functionality and capability. Excepting code that uses add-on packages (a.k.a. toolboxes), the vast majority of code written in MATLAB will work in Octave and vice versa, which is nice if you find yourself with some MATLAB code but no license.

Overall, MATLAB and Octave are great for engineers (in particular electrical) who work with large matrices in signal processing, communications, image processing, and optimization, among others.
R is based on the S programming language that was created at Bell Labs. It’s open source, but its license is somewhat more restrictive than some other popular languages like Python and Java, particularly if you’re building a commercial software product. Compared to MATLAB, in R it’s easier to load and handle different types of data. MATLAB is good at handling tabular data but, generally speaking, R is better with tables with headers, mixed column types (integer, decimal, strings, and so on), JSON, and database queries. When reading tabular data, R tends to default to returning an object of the type data frame. Data frames are versatile objects containing data in columns, where each column can be of a different data type — for example, numeric, string, or even matrix — but all entries in each column must be the same. Working with data frames can be confusing at first, but their versatility and power are certainly evident after a while.
One of the advantages of R being open source is that it’s far easier for developers to contribute to language and package development wherever they see fit. These open-source contributions have helped R grow immensely and expand its compatibility with other software tools. Thousands of packages are available for R from the CRAN website. This is the single greatest strength of the R language; chances are you can find a package that helps you perform the type of analysis you’d like to do, so some of the work has been done for you. MATLAB also has packages, but not nearly as many, though they’re usually very good. R has good ones and bad ones and everything in between. You’ll also find tons of R code that’s freely available in public repos but that might not have made it to official package status.

Overall, R is a good choice for statisticians and others who pursue data-heavy, exploratory work more than they build production software in, for example, the analytic software industry.
Python is a powerful language that can be used for both scripting and creating production software. It lends itself more naturally to non-statistical tasks like integrating with other software services, creating APIs and web services, and building applications. Likely because Python was originally a general-purpose programming language, it has a robust framework for object-oriented design.
Although Python wasn’t originally intended to be a heavily statistical language, several packages have been developed for Python that elevate it to compete with R and MATLAB. The numpy package for numerical methods is indispensable when working with vectors, arrays, and matrices. The packages scipy and scikit-learn add functionality in optimization, integration, clustering, regression, classification, and machine learning, among other techniques. With those three packages, Python rivals the core functionality of both R and MATLAB, and in some areas, such as machine learning, Python seems to be more popular among data scientists. For data handling, the package pandas has become incredibly popular. It’s influenced somewhat by the notion of a data frame in R but has since surpassed that in functionality. If your data set is big enough to slow down calculations but small enough to fit in your computer’s memory, then pandas might be for you.
One of the most notable Python packages in data science, however, is the Natural Language Toolkit (NLTK). It’s easily the most popular and most robust tool for natural language processing (NLP). These days, if someone is parsing and analyzing text from Twitter, newsfeeds, the Enron email corpus, or somewhere else, it’s likely that they’ve used NLTK to do so. It makes use of other NLP tools such as WordNet and various methods of tokenization and stemming to offer the most comprehensive set of NLP capabilities found in one place.

Overall, Python is great for people who want to do some data science as well as some other pure, non-statistical software development. It’s the only popular, robust language that can do both well.
Though not a scripting language and as such not well suited for exploratory data science, Java is one of the most prominent languages for software application development, and because of this, it’s used often in analytic application development. Many of the same reasons that make Java bad for exploratory data science make it good for application development.
Java isn’t great for exploratory data science, but it can be great for large-scale or production code based on data science. Java has many statistical libraries for doing everything from optimization to machine learning. Many of these are provided and supported by the Apache Software Foundation.

In choosing your statistical software tools, keep these criteria in mind:
- Implementation of Methods: If you’re using a fairly common method, then many tools probably already have an implementation, and it’s probably better to use one of those. Code that’s been used by many people already is usually relatively error free compared to some code that you wrote in a day and used only once or twice.
- Flexibility: In addition to being able to perform the main statistical analysis that you want, it’s often helpful if a statistical tool can perform some related methods. Often you’ll find that the method you chose doesn’t quite work as well as you had hoped, and what you’ve learned in the process leads you to believe that a different method might work better. If your software tool doesn’t have any alternatives, then you’re either stuck with the first choice or you’ll have to switch to another tool.
- Informative: Some statistical tools, particularly higher-level ones like statistical programming languages, offer the capability to see inside nearly every statistical method and result, even black box methods like machine learning. These insides aren’t always user friendly, but at least they’re available.
- Commonality: With software, more people using a tool means more people have tried it, gotten results, examined the results, and probably reported the problems they had, if any. In that way, software, notably open-source software, has a feedback loop that fixes mistakes and problems in a reasonably timely fashion. The more people participating in this feedback loop, the more likely it is that a piece of software is relatively bug free and otherwise robust.
- Well-documentation: In addition to being in common use, a statistical software tool should have comprehensive and helpful documentation. It’s a bad sign if you can’t find answers to some big questions, such as how to configure inputs for doing linear regression or how to format the features for machine learning. If the answers to big questions aren’t in the documentation, then it’s going to be even harder to find answers to the more particular questions that you’ll inevitably run into later.
- Purpose-built: Some software tools or their packages were built for a specific purpose, and then other functionality was added on later. For example, the matrix algebra routines in MATLAB and R were of primary concern when the languages were built, so it’s safe to assume that they’re comprehensive and robust. In contrast, matrix algebra wasn’t of primary concern in the initial versions of Python and Java, and so these capabilities were added later in the form of packages and libraries.
- Inter-operability: If you’re working with a database, it can be helpful to use a tool that can interact with the database directly. If you’re going to build a web application based on your results, you might want to choose a tool that supports web frameworks — or at least one that can export data in JSON or some other web-friendly format. Or if you’ll use your statistical tool on various types of computers, then you’ll want the software to be able to run on the various operating systems. It’s not uncommon to integrate a statistical software method into a completely different language or tool.
- Permissive licenses: If you’re using commercial software for commercial purposes, it can be legally risky to be doing so with an academic or student license. It can also be dangerous to sell commercial software, modified or not, to someone else without confirming that the license doesn’t prohibit this.
8 — Optimizing Data

The 8th step in our process is to optimize a product with supplementary software. The software tools in our 7th step can be versatile, but they’re statistical by nature. Software can do much more than statistics. In particular, many tools are available that are designed to store, manage, and move data efficiently. Some can make almost every aspect of calculation and analysis faster and easier to manage. Here are 4 popular software that can make your work as a data scientist easier.
Databases are common, and your chances of running across one during a project are fairly high, particularly if you’re going to be using data that are used by others quite often. But instead of merely running into one as a matter of course, it might be worthwhile to set up a database yourself to aid you in your project. The 2 most common types are relational (SQL) and document-oriented (NoSQL, ElasticSearch). Databases and other related types of data stores can have a number of advantages over storing your data on a computer’s file system. Mostly, databases can provide arbitrary access to your data — via queries — more quickly than the file system can, and they can also scale to large sizes, with redundancy, in convenient ways that can be superior to file system scaling.
High-performance computing (HPC) is the general term applied to cases where there’s a lot of computing to do and you want to do it as fast as possible. You can either use a supercomputer (which is millions of times faster than a personal computer), computer clusters (a bunch of computers that are connected with each other, usually over a local network, and configured to work well with each other in performing computing tasks), or Graphics Processing Units (which are great at performing highly parallelizable calculations). If you have access then HPC is a good alternative to waiting for your PC to calculate all the things that need to be calculated. The benefit of using a cloud HPC offering — and some pretty powerful machines are available — must be weighed against the monetary cost before you opt in.
The largest providers of cloud services are mostly large technology companies whose core business is something else. Companies like Amazon, Google, and Microsoft already had vast amounts of computing and storage resources before they opened them up to the public. But they weren’t always using the resources to their maximum capacity, and so they decided both to rent out excess capacity and to expand their total capacity, in what has turned out to be a series of lucrative business decisions. Services offered are usually rough equivalent to the functionality of a personal computer, computer cluster, or local network. All are available in geographic regions around the world, accessible via an online connection and standard connection protocols, as well as, usually, a web browser interface. If you don’t own enough resources to adequately address your data science needs, it’s worth considering cloud services.
Lastly, you can try big data technologies: Hadoop, HBase, and Hive — among others. Big data technologies are designed not to move data around much. This saves time and money when the data sets are on the very large scales for which the technologies were designed. Whenever computational tasks are data-transfer bound, big data can give you a boost in efficiency. But more so than the other technologies described in this chapter, big data software takes some effort to get running with your software. You should make the leap only if you have the time and resources to fiddle with the software and its configurations and if you’re nearly certain that you’ll reap considerable benefits from it.
9 — Executing Plan

The last step of the build phase is executing the build plan for the product. Most software engineers are probably familiar with the trials and tribulations of building a complicated piece of software, but they may not be familiar with the difficulty of building software that deals with data of dubious quality. Statisticians, on the other hand, know what it’s like to have dirty data but may have little experience with building higher-quality software. Likewise, individuals in different roles relating to the project, each of whom might possess various experiences and training, will expect and prepare for different things.
- If you’re a statistician, you know dirty data, and you know about bias and overstating the significance of results. On the other hand, you may not have much experience building software for business, particularly production software. You should consult software engineers with hands-on experience to learn how to improve your software’s robustness.
- If you’re a software engineer, you know what a development lifecycle looks like, and you know how to test software before deployment and delivery. But you may not know about data and no matter how good you are at software design and development, data will eventually break your application in ways that had never occurred to you. This requires new patterns of thought when building software and a new level of tolerance for errors and bugs because they’ll happen that much more often. You should consult statisticians who are well versed in foreseeing and handling problematic data such as outliers, missing values, and corrupted values.
- If you’re starting out in data science, without much experience in statistics or software engineering, anyone with some experience can probably give you some solid advice if you can explain your project and your goals to them. As a beginner, you have double duty at this stage of the process to make up for lack of experience.
- If you’re merely one member of a team for the purposes of this project, communication and coordination are paramount. It isn’t necessary that you know everything that’s going on within the team, but it is necessary that goals and expectations are clear and that someone is managing the team as a whole.
The plan should contain multiple paths and options, all depending on the outcomes, goals, and deadlines of the project. No matter how good a plan is, there’s always a chance that it should be revised as the project progresses. Even if you thought of all uncertainties and were aware of every possible outcome, things outside the scope of the plan may change. The most common reason for a plan needing to change is that new information comes to light, from a source external to the project, and either one or more of the plan’s paths change or the goals themselves change.
As a project progresses, you usually see more and more results accumulate, giving you a chance to make sure they meet your expectations. Generally speaking, in a data science project involving statistics, expectations are based either on a notion of statistical significance or on some other concept of the practical usefulness or applicability of those results or both. Statistical significance and practical usefulness are often closely related and are certainly not mutually exclusive. As part of your plan for the project, you probably included a goal of achieving some accuracy or significance in the results of your statistical analyses. Meeting these goals would be considered a success for the project.
Phase III — Finishing
Once a product is built, you still have a few things left to do to make the project more successful and to make your future life easier. So how can we finish our data science project?
10 — Delivering Product

The first step of the finishing phase is product delivery. In order to create an effective product that you can deliver to the customer, first you must understand the customer perspective. Second, you need to choose the best media for the project and for the customer. And finally, you must choose what information and results to include in the product and what to leave out. Making good choices throughout product creation and delivery can greatly improve the project’s chances for success.
The delivery media can take many forms. In data science, one of the most important aspects of a product is whether the customer passively consumes information from it, or whether the customer actively engages the product and is able to use the product to answer any of a multitude of possible questions. Various types of products can fall anywhere along the spectrum between passive and active:
- Probably the simplest option for delivering results to a customer, a report or white paper includes text, tables, figures, and other information that address some or all of the questions that your project was intended to answer. Reports and white papers might be printed on paper or delivered as PDFs or other electronic format.
- In some data science projects, the analyses and results from the data set can also be used on data outside the original scope of the project, which might include data generated after the original data (in the future), similar data from a different source, or other data that hasn’t been analyzed yet for one reason or another. In these cases, it can be helpful to the customer if you can create an analytical tool for them that can perform these analyses and generate results on new data sets. If the customer can use this analytical tool effectively, it might allow them to generate any number of results and continue to answer their primary questions well into the future and on various (but similar) data sets.
- If you want to deliver a product that’s a step more toward active than an analytical tool, you’ll likely need to build a full-fledged application of some sort. The most important thing to remember about interactive graphical applications, if you’re considering delivering one, is that you have to design, build, and deploy it. Often, none of these is a small task. If you want the application to have many capabilities and be flexible, designing it and building it become even more difficult.
In addition to deciding the medium in which to deliver your results, you must also decide which results it will contain. Once you choose a product, you have to figure out the content you’ll use to fill it.
Some results and content may be obvious choices for inclusion, but the decision may not be so obvious for other bits of information. Typically, you want to include as much helpful information and as many results as possible, but you want to avoid any possibility that the customer might misinterpret or misuse any results you choose to include. This can be a delicate balance in many situations, and it depends greatly on the specific project as well as the knowledge and experience of the customer and the rest of the audience for the results.
11 — Making Revisions

After delivering the product, we move on to revising the product after initial feedback. Once the customer begins using the product, there’s the potential for a whole new set of problems and issues to pop up. Despite your best efforts, you may not have anticipated every aspect of the way your customers will use (or try to use) your product. Even if the product does the things it’s supposed to do, your customers and users may not be doing those things and doing them efficiently.
Getting feedback is hard. On the one hand, it’s often difficult to get constructive feedback from customers, users, or anyone else. On the other hand, it can be hard to listen to feedback and criticism without considering it an attack on — or a misunderstanding of — the product that you’ve spent a lot of time and effort building. Some data scientists deliver products and forget about them. Some data scientists deliver products and wait for customers to give feedback. Some data scientists deliver products and bug those customers constantly. It’s often a good idea to follow up with your customers to make sure that the product you delivered addresses some of the problems that it was intended to address.
Making product revisions can be tricky, and finding an appropriate solution and implementation strategy depends on the type of problem you’ve encountered and what you have to change to fix it. If, throughout the project, you’ve maintained awareness of uncertainty and of the many possible outcomes at every step along the way, it’s probably not surprising that you find yourself now confronting an outcome different from the one you previously expected. But that same awareness can virtually guarantee that you’re at least close to a solution that works. Practically speaking, that means you never expected to get everything 100% correct the first time through, so of course there are problems. But if you’ve been diligent, the problems are small and the fixes are relatively easy.
Once you recognize a problem with the product and figure out how it can be fixed, there remains the decision of whether to fix it. The initial inclination of some people is that every problem needs to be fixed; that isn’t necessarily true. There are reasons why you might not want to make a product revision that fixes a problem, just as there are reasons why you would. The important thing is to stop and consider the options rather than blindly fixing every problem found, which can cost a lot of time and effort.
12 — Wrapping Up Project

The last step in our data science process is to wrap it up. As a project in data science comes to an end, it can seem like all the work has been done, and all that remains is to fix any remaining bugs or other problems before you can stop thinking about the project entirely and move on to the next one (continued product support and improvement notwithstanding). But before calling the project done, there are some things you can do to increase your chances of success in the future, whether with an extension of this same project or with a completely different project.
There are two ways in which doing something now could increase your chances of success in the future. One way is to make sure that at any point in the future you can easily pick up this project again and redo it, extend it, or modify it. By doing so you will be increasing your chance of success in that follow-on project, as compared to the case when a few months or years from now you dig up your project materials and code and find that you don’t remember exactly what you did or how you did it. Two practical ways to do are through documentation and storage.
Another way to increase your chances of success in future projects is to learn as much as possible from this project and carry that knowledge with you into every future project. By conducting a project postmortem, you can hope to tease out the useful lessons from the rest. This includes reviewing the old goals, the old plan, your technology choices, the team collaboration etc. Whether there’s a specific lesson you can apply to future projects or a general lesson that contributes to your awareness of possible, unexpected outcomes, thinking through the project during a postmortem review can help uncover useful knowledge that will enable you to do things differently — and hopefully better — next time.
If you take away only one lesson from each project, it should probably relate to the biggest surprise that happened along the way. Uncertainty can creep into about every aspect of your work, and remembering all the uncertainties that caused problems for you in the past can hopefully prevent similar ones from happening again. From the data to the analysis to the project’s goals, almost anything might change on short notice. Staying aware of all of the possibilities is not only a difficult challenge but is near impossible. The difference between a good data scientist and a great data scientist is the ability to foresee what might go wrong and prepare for it.
Conclusion

Data science still carries the aura of a new field. Most of its components — statistics, software development, evidence-based problem solving, and so on — descend directly from well-established, even old fields, but data science seems to be a fresh assemblage of these pieces into something that is new. The core of data science doesn’t concern itself with specific database implementations or programming languages, even if these are indispensable to practitioners. The core is the interplay between data content, the goals of a given project, and the data-analytic methods used to achieve those goals.
I’d highly you to check out Brian’s book to get more details on each step of the data science process. It is very accessible for non-experts in data science, software, and statistics. It paints a vivid picture of data science as a process with many nuances, caveats, and uncertainties. The power of data science lies not in figuring out what should happen next, but in realizing what might happen next and eventually finding out what does happen next.
— —
If you enjoyed this piece, I’d love it if you can share it on social media so others might stumble upon it. You can find my own code on GitHub and more of my writing and projects at https://jameskle.com/. You can also follow me on Twitter, email me directly or find me on LinkedIn. Sign up for my newsletter to receive my latest thoughts on data science, machine learning, and artificial intelligence right at your inbox!