This post is going to cover some very basic concepts in machine learning, from linear algebra to evaluation metrics. It serves as a nice guide to newbies looking to enter the field.

Linera Algebra
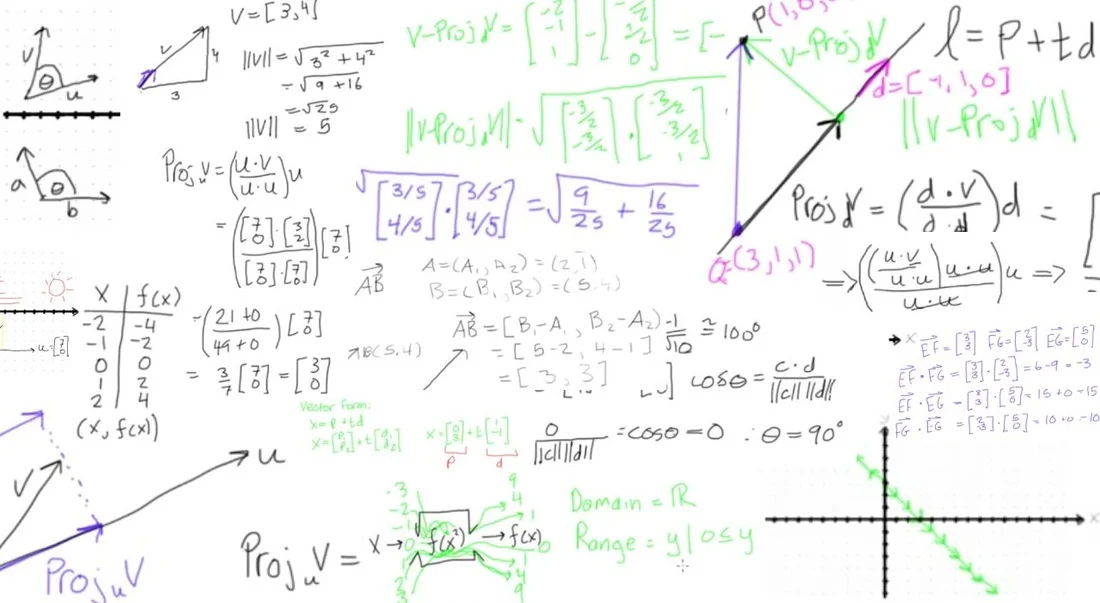
Linear algebra is the core pillar in the field of machine learning. Why? Machine learning algorithms are described in books, papers and on website using vector and matrix notation. Linear algebra is the math of data and its notation allows you to describe operations on data precisely with specific operators. The 2 most important concepts in linear algebra you should be familiar with are vectors and matrices.
1 — Vectors
A vector is a tuple of one or more values known as scalars. It is common to introduce vectors using geometric definition, in which a vector represents a point or coordinate in a high-dimensional space. The main vector arithmetic operations are addition, subtraction, multiplication, division, dot product, and scalar multiplication.
Two vectors of equal length can be added together to create a new third vector.
One vector can be subtracted from another vector of equal length to create a new third vector.
Two vectors of equal length can be multiplied together.
Two vectors of equal length can be divided.
The dot product is the sum of the multiplied elements of two vectors of the same length to give a scalar.
A vector can be multiplied by a scalar to scale the magnitude of the vector.
There are many uses of vectors. For example, vectors can represent an offset in 2D or 3D space. Points are just vectors from the origin. Data (pixels, gradients at an image key point, etc) can also be treated as a vector.
2 — Matrices
A matrix is a 2-dimensional array of scalars with one or more columns and one or more rows. If the matrix has the same number of rows and columns, then it is a square matrix. Identity matrix is a square matrix with 1’s on the diagonal and 0’s everywhere else. Diagonal matrix is a square matrix with numbers on the diagonal and 0s elsewhere. A column vector is just a matrix in which there is one row, while a row vector is just a matrix in which there is one column.
The basic matrix operations are addition, scaling, dot product, vector multiplication, scalar multiplication, transpose, inverse, and determinant / trace.
Two matrices with the same dimensions can be added together to create a new third matrix.
Similarly, one matrix can be subtracted from another matrix with the same dimensions.
Two matrices with the same size can be multiplied together, and this is often called element-wise matrix multiplication.
One matrix can be divided by another matrix with the same dimensions.
Matrix dot product has the entries of 2 vectors multiplied times each other and adding up the result.
A matrix and a vector can be multiplied together as long as the rule of matrix multiplication is observed.
A matrix can be multiplied by a scalar. The result is a matrix with the same size as the parent matrix where each element of the matrix is multiplied by the scalar value.
Matrix transpose is when we flip a matrix’s columns and rows, so row 1 is now column 1, and so on.
Given a matrix A, its inverse A^(-1) is a matrix such that A x A^(-1) = I. If A^(-1) exists, then A is invertible or non-singular. Otherwise, it is singular.
Machine Learning
1 — Main Approaches
The 3 major approaches to machine learning are:
Unsupervised Learning, which is used a lot in computer vision. Examples are k-means, ICA, PCA, Gaussian Mixture Models, and deep auto-encoders.
Supervised Learning, which is also used a lot in computer vision. Examples are deep supervised neural networks.
Reinforcement Learning, which is mostly used for robotics and control problems. Examples are deep Q-learning and policy gradient methods.

In Reinforcement Learning, the rules of the game are unknown. There is no supervisor, only a reward signal with delayed feedback. The agent’s actions affect the subsequent data it receives.
In Unsupervised Learning, we want to find structure and meaning in data without any labels. As mentioned above, example algorithms are Principal Component Analysis, k-means, Non-Negative Matrix Factorization, Independent Component Analysis, Gaussian Mixture Models, Latent Dirichlet Allocation, and Auto-Encoders.
In Supervised Learning, the basic terminology is such that we have an initial input space x and an initial output space y. After seeing a bunch of examples (x, y), we want to pick a mapping F: x -> y that accurately replicates the input-output pattern of the examples. There are lots of algorithms for finding different models of F from labeled observations (ground truth). Often learning is categorized according to their output space, which can be either discrete or continuous.
Continuous output space is used in regression problem. For example, given the input as an image of a plate of food, we want the output as the number of total calories. Or given the input as a person’s face, we want the output as that person’s age.
With discrete output space, we are typically building classifiers. For example, we want the output to be class 1, class 2, class 3…, where the numbers represent some sort of meaningful category. We can also call these labels or categories.
2 — Training Data and Test Data
Training data is what we give to the classifier during the training process. This is the paired data for learning f(x) = y, where x is the input (a vector of features in R^d) and y is the output (a label with classification). During training, we try to find a good model of f(x) that replicates the input-output relationship of the data.
Test data is used with a trained classifier to assess it. We have x, but we don’t know y. Usually, we only pretend to not have y in research, but in the real world, you truly won’t have it. The trained system predicts y for us, and we assess how well the system works.
3 — Probabilities
Instead of only categorizing an input into one of K different classes, we may want to know the probability of each of those classes. For each possible category, P(C = k | x) returns a value between 0 and 1, with values closer to 1 meaning the classifier “thinks” that class is likely the category of the input. To classify, we want to pick the biggest P(C = k | x).
4 — Parametric and Non-Parametric
Parametric models involve fitting parameters. For example, we want to find good values for the w vectors for our linear classifier. Parametric models have a finite number of parameters, in which the number of parameters is independent of the training set.
Non-parametric models involve storing the data and using them somehow. Here, the number of parameters depends on the training set (how much data you store). More specifically, the number of parameters grows with the size of the training set.
Evaluating Machine Learning Classifiers
After seeing a bunch of examples (x, y), the model picks a mapping F: x -> y that replicates the input-output pattern of the examples. The question is how well does the model F work after training? We can evaluate F on the training data, but performance on the training data does not really tell us how well the model generalizes to other data. In other words, F could just memorize the training data. Thus, we must evaluate on the test data to get a better idea of how well the model works.
The simplest evaluation measure for classification is accuracy, which is the fraction of points correctly classified. The accuracy can be calculated to be the sum of true positives and true negatives, divided by all data points. The error rate is simply 1 — Accuracy, or the sum of false positives and false negatives, divided by all data points.
In order to implement accuracy, the best way is to store your predictions for each test vector x_t. So, if you have a total of T vectors to test, you end up with a T-dimensional vector with all of your predictions and then just compare it to ground truth. You could also save the probabilities to compute other metrics, but this may require a lot of memory if you have many classes.

1 — Confusion Matrix
A confusion matrix is a specific table layout that allows visualization of the performance of an algorithm, typically a supervised learning one. Each row of the matrix represents the instances in a predicted class while each column represents the instances in an actual class. It lets you see what classes are most confused. A “strong” diagonal indicates good performance. In a normalized confusion matrix, the rows are normalized to sum to 1.
2 — Precision and Recall
Precision is the number of correctly classified positive examples divided by the total number of examples that are classified as positive. Recall is the number of correctly classified positive examples divided by the total number of actual positive examples in the test set. Precision-Recall is a dominant metric in object detection and is especially useful when categories are unbalanced. High precision means that an algorithm returned substantially more relevant results than irrelevant, while high recall means that an algorithm returned most of the relevant results.
3 — Classifier Thresholds
Often a classifier will have some confidence value in each category. These are most often generated by probabilistic classifiers. Sometimes, we threshold the probability values. In computer vision, this happens a lot in detection. The optimal threshold varies depends on the tasks. Some performance metrics are sensitive to the threshold. By changing the value of the threshold from the min to the max (from 0 to 1), we can draw a curve (ROC and Precision-Recall Curves).

Model Power
1 — Overfitting & Underfitting
Your classifier F is said to overfit the data if the training performance is much greater than the test performance. On the other hand, F underfits the data when it is not powerful enough to model the input-output relationship.
2 — Model Capacity
Model capacity refers to the number of parameters. Bigger capacity generally means you need more training data to train the model, otherwise, it has a high risk of overfitting. On the other hand, low capacity probably means that you underfit the training data significantly.
Specifically, with neural networks, more neurons mean more capacity. A good analogy is that linear classifier has very low capacity and deep neural network has a lot of capacity. With more training data, the more complex model wins. Classifiers with a greater model can create complex decision boundaries, but too complex may be a poor model for the test data, especially if data is limited.
3 — Sample Complexity
Sample complexity is the number of training samples that we need to supply to the learning algorithm so that the function returned by the algorithm is within an arbitrarily small error of the best possible function (train and test). Algorithms with larger model capacity tend to have worse sample complexity because they have more parameters to fit and are likely to overfit with insufficient training data. In those cases, regularization techniques can help.
If you’re interested in this material, follow the Cracking Data Science Interview publication to receive my subsequent articles on how to crack the data science interview process.