
The field of MLOps is rapidly gaining momentum among Data Scientists, Machine Learning Engineers, Machine Learning Researchers, Data Engineers, Machine Learning Product Managers, and any other roles that involve the process of designing, building, and managing ML-powered software. I have been quite interested in learning more about MLOps to get a good understanding of the current state as it is a quickly evolving field.
Two weeks ago, I attended the inaugural MLOps: Production and Engineering World, which is a two-day virtual conference organized by the Toronto Machine Learning Society that explores the best practices, methodologies, and principles of effective MLOps. In this post, I would like to share content from the talks that I attended during this conference.
The post consists of 5 parts:
ML Project Management
ML Metrics
ML Research
ML Case Studies
ML Tools
1 — Project Management
In his talk “The Do’s and Dont’s of Delivering AI Projects,” Jan Zawadzki shared his practical tips on ideating, evaluating, and scoping AI projects.
While traditional projects succeed more often than not, AI projects often fail to deliver. This is because it’s quite tricky to define what makes good AI projects. This is also the first step in the AI value stream that includes: (1) Define Project, (2) Prototype Model, (3) Productionize Model, and (4) Measure Results.
Before getting started, we need to understand where our company is on the AI Maturity Journey. More specifically, AI projects can be classified by their potential impact and risk into four groups, as seen below.

Jan Zawadzki — The Beauty of Holy Grail AI Projects (https://www.experfy.com/blog/the-beauty-of-holy-grail-ai-projects-and-how-to-find-them/)
Solid Start: These low-impact, low-risk projects should be the one to start our AI journey.
Holy Grail: These high-impact, low-risk projects fall into the sweet spot of the AI maturity curve. They are likely to succeed and can bring a high impact on your business.
Calculated Bet: These high-impact, high-risk projects are the ones to target as our business becomes more mature.
No-No-Never: These low-impact, high-risk projects are those to avoid at all costs.
In the beginning, we would want to generate as many AI project ideas as possible, and then we can evaluate and scope them. To discover the ideas, Jan suggested tools like AI The Game or Design Thinking that can help us come up with Solid Starts or Calculated Bets projects.
To scope our discovered AI project ideas, Jan proposed the AI Project Canvas to examine the value proposition, data, customer, and financial aspects of the projects. The ones that are most likely to succeed have clear value definitions, available data, customer needs, and within-reach capital.
And to rank those ideas, Jan proposed the RICE method:
Reach: How many customers will benefit from the solution?
Impact: How much dices this feature benefit toward our current goals?
Confidence: How sure are you that you can deliver the AI Project?
Effort: How much time does it take to execute the AI Project?
The final RICE score is calculated to be (R x I x C) / E
In an entertaining talk, “Create Harmony Between ML Engineers and ML Researchers,” Luna Feng discussed the challenges to bring an ML solution into production regarding the collaborations between ML engineers and researchers. For the context, she has been an engineer and a researcher at Thomson Reuters Center for AI and Cognitive Computing over the past years in different periods.

Thomson Reuters Labs (https://innovation.thomsonreuters.com/en/labs.html)
She sent a survey to the internal team at her company consisting of 7 researchers and 8 engineers and then analyzed the data to come up with the insights.
The collective skills that overlap between both roles are Python, Java, and Version Control.
The daily tasks of the engineers include: working on system design and model integration, building model infrastructure, fixing bugs, developing/integrating new features and models.
The daily tasks of the researchers include reading/writing papers, pre-processing data, running experiments, implement ideas, fixing bugs.
The usual tasks that are common between them include code review, code re-factoring, feature integration, unit tests, debugging.
The collaboration happens most frequently during the model deployment phase.
She discussed the skills that engineers and researchers expect from each other:
The researchers expect the engineers to communicate more often about the priorities and purposes of feature/bug tickets. It is also helpful for engineers to gain technical knowledge of basic machine learning concepts.
The engineers expect the researchers to improve the knowledge of different machine learning services provided by AWS, the basic understanding of code design principles, and the appreciation for unit tests and build frameworks.
She also went over the challenges that happen during the collaboration:
From the perspective of the engineers: The researchers have different levels of experience with engineering practices such as unit testing, code re-use, code comments, etc. It is often hard to understand the code written by the researchers in-depth (feature engineering, model outputs, the actual algorithms). Furthermore, build failures and memory issues are common problems with machine learning products.
From the perspective of the researchers: It is challenging to explain technical machine learning concepts to engineers in a simple way. They don’t have much exposure to version control and other software engineering concepts, leading to an out-of-sync workflow with the engineers.
She proposed helpful methods to improve work efficiency between the two functions:
There is a need for knowledge-sharing mediums, such as team meetings/stand-ups/sprints, blog posts, and presentation series/workshops.
Clear documentation and a well-organized repository on how to perform specific tasks can help.
The researchers and engineers should frequently meet when a model is picked before the integration begins. This will help them exchange pain points, pair program closely, and write clear and thorough comments.
2 — Metrics
In her talk “Monitoring Machine Learning Stacks,” Lina Weichbrodt revealed why current monitoring methods for machine learning models are ineffective. Machine learning stacks are often monitored like any other software services: via the four golden signals of latency, errors, traffic, and saturation. These are good signals, but usually not enough to detect particular types of problems associated with machine learning services.
For example, let’s say we are building a recommendation service. There are multiple components involved, such as the client-side, the model configuration, the training data, the external service, etc. There can be issues that come up during the interaction between any of these components: bad requests, buggy code, under-fitting model, out-of-date data, etc. Such problems can lead to degraded performance, thus wasting time and effort on the project just to improve the performance by a few percent!
To combat such issues, Lina argued for the need for a clear definition of a successful metric. An example: For personalized recommendations on an e-Commerce HomePage, we expect more than 65% of responses to have at least four personalized articles in under 200ms.
Furthermore, she said that we should not monitor user actions and the actual model itself:
User actions often don’t have all the necessary fields to calculate your quality metric. They are less frequent, noisier, and typically less reliably tracked, so even a drop by 10% is hard to detect. They are also more often not retrievable in real-time and require more effort for integration and maintenance.
In terms of the model itself, we can’t monitor things that happen after the modeling step.
To select a quality metric, we need to think carefully about our business case. Often, simple heuristics are adequate, and there is no need for user-perceived quality. Some of the suggested criteria for this metric are:
It should be comparable across models.
It should be simple and easy to understand.
It can be collected in real-time.
It allows for actionable alerting on problems.

Lina Weichbrodt - An Example Recommendation Service
At the end of the talk, Lina walked through a case study on how such metrics work for the recommendation stacks at Zalando, one of Europe’s largest fashion retailers.
The recommendations are created from a sequence of configurations via model and filtering rules.
Then the implementation was done with simple metrics of good and poor responses.
Alerting is triggered by a threshold per use case.
Longer time ranges are useful for analysis.
Quality alerts can be used during deployment to detect bugs in the new version of the stack (by measuring the distribution of differences between old and new stacks).
In her talk “Holistic Health Metrics of ML-Based Products,” Lina Palianytsia from GlobalLogic talked about the concept of holistic health metric — a quality monitoring tool that collects metrics at different stages of ML-based products. This tool can be a simple dashboard that acts as a safety net for your product.
A common objective for ML-based products is always to be sure that the whole system produces correct results. Depending on a domain, this problem could be less or more critical. For example, in the finance and health industries, errors could be very pricey. Building a holistic metrics system that covers all blocks of the application will help to avoid mistakes, react fast when they occur, and reduce manual work.
So when should we measure metrics?
On training: Getting metrics during the training process can be crucial when we have two or more models in production.
Regular: This simply means getting metrics in proper time intervals (every day, weekly, bi-weekly, etc.)
Live: A good practice is to measure metrics right after the inference step is triggered.
And where should we measure metrics?
In the step going from raw inputs to pre-processed inputs.
In the step going from pre-processed data to model training.
In the step going from model training to post-processed outputs.
In the step going from post-processed outputs to the product UI that interfaces users.
For a system with more than one model, we should use multiple model metrics.
Finally, here are crucial aspects that she recommended paying attention to:
Metrics should evolve together with our product and our understanding of it.
We should always collect and display metrics at one easily accessible place.
We must dedicate time and people for metrics tool adoption and support.
We need to assign responsible people to react to alerts.
Many things can cause models to underperform in production: model staleness, problems with pipelines creating the input features, “attacks” on the models, and more. In many cases, performance measures that may indicate issues with the models are not directly their accuracy (which is usually attainable with a delay). Instead, they are auxiliary measures that should have stable behavior over time. Therefore, abnormal changes in them indicate a potential issue that should be investigated.
In “Scalable Monitoring of Machine Learning Models in Production Environments,” Ira Cohen describes the steps to monitor the unexpected changes mentioned above.
Step 1 is to collect the input and output of the models.
Step 2 is to create metrics by measuring statistics over time. For the inputs, these are the distributions of feature values such as mean, standard deviation, inter-quartile range, counts, percentiles, histogram, etc. For the outputs, these are the distributions of predicted classes, the confidence of the winning class, the confusion matrix, etc.
Step 3 is to monitor the metrics for unexpected changes. Simple dashboards won’t scale with millions of models deployed in production. Thus, the solution Ira suggests is to use automated time-series anomaly detection to monitor those metrics.

Anodot - Introducing MLWatcher (https://www.anodot.com/blog/mlwatcher/)
For the last step, Ira presents an open-source monitoring agent from his team at Anodot. MLWatcher automatically generates a lot of the proposed model performance measures, so data science teams can track them and get alerted on issues in production that require their attention.
3 — Research
In “Privacy-Preserving Machine Learning,” Patricia Thaine provided practical examples to show how to strategically think about privacy problems. Generally speaking, the four pillars for perfectly privacy-preserving machine learning include (1) training data privacy, (2) input data privacy, (3) model weights privacy, and (4) output data privacy.
An organization aiming to create a privacy-preserving machine learning pipeline is faced with a plethora of privacy tools to choose from, which can either be used on their own or in combination with one another to achieve different privacy goals. These tools include federated learning, homomorphic encryption, differential privacy, anonymization/pseudonymization, secure multiparty computation, and trusted execution environments, among others.

Patricia Thaine — Which Privacy-Preserving Methods Should I Use? (https://medium.com/privacy-preserving-natural-language-processing/which-privacy-preserving-method-should-i-use-b9f0dc41cc46)
There are various real-world applications of these tools:
Homomorphic encryption has been used extensively for genomic data analysis.
Secure multiparty computation has been used for facial and fingerprint recognition.
Differential privacy has been used in Apple’s QuickType and Google’s GBoard prediction to randomize the responses.
Anonymization and pseudonymization have been used to de-identify clinical datasets to protect client’s identities.
Data synthesis has been used to create synthetic structured healthcare data.
What I took away from this talk is that we can protect users’ private data while continuing to use them for machine learning applications. When choosing which privacy-preserving method(s) to use, we need an evident understanding of the problems at hand. Furthermore, there is plenty of room for research and innovation in the area of privacy-preserving AI. Check out Patricia’s company Private AI for more details!
4 — Case Studies
In “Automated Pipeline For Large-Scale Neural Network Training and Inference,” Ebrahim Safavi and Jisheng Wang at Mist shared lessons learned and insights on how to productize and monitor thousands of ML models to automate anomaly detection.
For context, Mist’s core product is AI-driven Wireless LAN (WLAN), which makes Wi-Fi predictable, reliable, and measurable and enables scalable indoor location services like wayfinding, proximity messaging, and asset visibility. This system consists of many different components, including wireless segment, wired segment, firewall, internet segment, and infrastructure data center. In particular, they use a cloud-based distributed software architecture with four layers:
Data Layer: This layer includes time series stats/events/configuration/logs coming from user/app/network devices
Events Layer: This layer includes model monitoring and baselining, anomaly detection, incident, and health events.
Diagnosis Layer: This layer includes spatial and scope analysis, temporal events, cross-entity correlation.
Actions Layer: This layer includes automated and suggested actions, troubleshoot assistant.

Mist — AI for IT (https://www.mist.com/artificial-intelligence-for-it/)
Anomaly detection models are essential at Mist to measure temporal-spatial information and monitor system health proactively. For these types of models, there are various features to pay attention to: spatial (which are unique to the clients and devices), state (authentication, association, unclear), statistical (also exclusive to the clients and devices), and seasonality (hours, days, weeks).
The team at Mist has gone through different types of models: starting with heuristic approaches, then moving average windows, then online ARIMA, and finally ending up with LSTM Neural Networks. This final type of model is a Bidirectional LSTM with 100 hidden nodes and 27000 parameters, which leverages a large amount of data across numerous dimensions to capture trends and catch anomalies across thousands of Wi-Fi networks and address issues in real-time. Besides, to address the challenges imposed by the stochastic nature of unsupervised anomaly detection on the workflow pipeline, they also have developed novel statistical models for the training workflow to leverage historical data.
To manage tens of thousands of anomaly detection models, they have built a cloud-native and scalable ML training pipeline that automates all steps of ML operations, including data collection, model training, model validation, model deployment, and version control. Here, the anomaly detection service happens hourly, and the training jobs occur weekly. The inference workflow is decoupled from the training process to increase the agility and minimize the delay of model service. The workflow pipeline utilizes different technologies, including Secor service, Amazon S3 service, Apache Spark jobs across Amazon EMR cluster, Apache Kafka input, Airflow scheduler, and ElasticSearch database.
In “MLOps At Scale: Predicting Bus Departure Times Using 18,000 Machine Learning Models,” Hubert Duan and Alice Gibbons discussed a unique case study that Microsoft worked on with TransLink, Metro Vancouver’s transit agency. TransLink needed more precise and reliable bus departure estimations to improve rider satisfaction. For this, they created the Bus Departure Prediction System: A large-scale, end-to-end Azure solution that uses over 18,000 machine learning models to predict when the next bus will depart from each stop.
This system leverages a micro-model service approach, where each model is separately trained and deployed but runs together in production. Here the data sources include weather, bus schedules, traffic, GPS, etc. The run-time model and the dwell-time model are XGBoost regression models that predict the delta between the actual and the expected departure time delay. These models are important for route planning and bus schedules.

Microsoft Customer Success (https://customers.microsoft.com/en-us/story/768972-translink-travel-and-transportation-azure)
When it comes to the sheer number of models involved, this is the largest single-solution deployment of ML models on Azure in Canada and one of the largest worldwide.
Architecture-wide, we start with the data sources, which are then fed to a data factory, which goes to Azure Data Services, which transitions to Azure Infrastructure-as-a-Service for training, which moves to Azure Machine Learning Model Management, and finally ends up in the customer’s production environment.
More specifically, the data ingestion, data transformation, model re-training, and model deployment steps are entirely automated.
Overall, the talk emphasized the importance of if an end-to-end MLOps process when operationalizing machine learning models at scale.
Unlike DevOps, which can be codified to a set of tools and practices to ensure consistent and efficient software delivery, the trial and error nature of ML projects poses a different set of challenges to MLOps. MLOps exists in the intersection of Development, Operations, Experimentation, and Application Delivery. Whereas DevOps challenges are things such as slow releases, changing pipelines, tight dependency, MLOps challenges are things such as data inconsistencies, distribution skew, dynamic environments, etc.
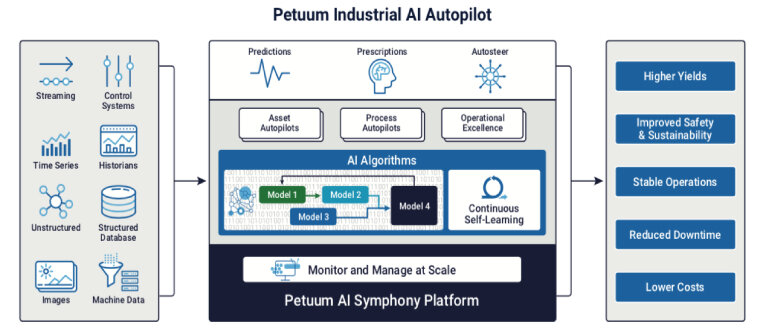
In “Design Patterns in MLOps,” Saranyan Vigrahan discusses major architectural patterns and anti-patterns based on his experience at Petuum, which uses machine learning to operate factory equipment autonomously. The talk mentioned the three levels of machine learning pipeline maturity:
Level 1 means manual deployment. This works when the models do not change, and it is easy to get started without having to worry about the pipeline.
Level 2 means automating parts of the pipeline. This utilizes CI/CD principles, which lead to faster time to deploy and less susceptibility to errors.
Level 3 goes all-in CI and CD, including the development, experimentation, and monitoring of the ML models.
Here are the six anti-patterns covered in the talk:
Sacrificing repeatability in favor of quick shipping. In reality, ML pipelines require rapid iteration, as deploying multiple models a day is typical. Thus, time-consuming phases such as model configuration, unit/integration testing, model validation should be automated.
Replicating the real world in your pipeline will keep models accurate. This is only applicable in settings such as Industrial AI. Instead of trying to get models to be highly precise in the production environment, you should focus on the infrastructure that allows fast model re-training. Especially in dynamic environments, the model validation phase does not need to replicate real-world settings.
Training-serving skew can be eliminated by focusing on consistency between training and serving infrastructure. Actually, rework latency matters much more!
There is an unjustified business cost of bringing new technology. At Petuum, Apache Spark was not a solution to everything. Saranyan mentioned that Apache Flink is a better solution in state management and works well for Internet-Of-Things problems.
Real-time and batch streaming infrastructure needs to be different. In reality, real-time support needs to scale with peak load and higher compute, while batch streaming has lower operational requirements.
Machine learning is the hard part. Well, there are various other challenges: lack of lifecycle management, handling self-contained packages, complete orchestration that has to run in unique sequences, etc.
Petuum — AI For All (https://builders.intel.com/ai/membership/petuum)
At the end of the talk, Saranyan summarized the mindset required to build robust machine learning pipelines:
Think carefully about repeatability.
Be comfortable with uncertainty.
Monitoring latency can be vital to address performance skew.
Allow the introduction and replacement of tools and frameworks to be easy.
Avoid redundancy in the infrastructure.
Pay attention to the entire model lifecycle.
5 — Tools
Pipeline debt is technical debt in data pipelines that are undocumented, untested, and unstable. In a machine learning system, pipeline debt can easily lead to the proliferation of unintended consequences and exponential growth of maintenance burden. In “Fighting Pipeline Debt with Great Expectations,” Abe Gong introduces Great Expectation — the leading open source project for fighting pipeline debt. Based on the concept of Expectations (assertions about data), it provides flexible tools for validating data against expectations, compiling expectations to human-readable documentation, and generating expectations by profiling sample data. Check out the website and participate in its growing open-source community!

Great Expectations (https://greatexpectations.io/)
Continuous Integration and Continuous Delivery is a common practice in traditional software engineering: you make changes to your code, you make a new build, and you run further tests. We, unfortunately, don’t have this yet in machine learning, because:
Version control like Github and Gitlab can’t always track changes in the dataset.
Training models are not like building software.
Evaluating metrics is way more complicated.
In “Adapting Continuous Integration and Continuous Delivery for Machine Learning,” Elle O’Brien introduces DVC, which is an open-source tool that extends CI/CD practices from software engineering to machine learning. Overall, here are the 3 most significant benefits that DVC can bring upon the machine learning workflow:
It provides feedback in the form of metric reports. When you make a pull request, you get a report that is inherently a customizable markdown document.
It versions data like code. DVC extends Git versioning to datasets and models with the help of GitHub Actions.
It lets the CI system allocate cloud resources to train models. You will never forget to turn off your cloud GPU again!

Data Version Control (https://github.com/iterative/dvc)
These are only 11 out of 43 talks at the conference. Overall, I have become more aware and gotten a clearer understanding of best practices, methodologies, principles, and opportunities around Machine Learning in Production. This is undoubtedly a new space that is getting a lot of attention right now, and my future blog posts will continue covering this topic with deeper insights.